The US furniture e-commerce market generated $72.9 billion in 2025. A significant chunk is quietly bleeding out through returns.
Processing a single returned sofa costs between 20% and 65% of its original sale price. The average US furniture order is $546. That’s not a rounding error, It’s a margin crisis.
The fix isn’t a better return policy. It’s stopping the return before it happens by giving the customer enough confidence to buy right the first time. That’s exactly what 3D furniture models do.
Why Furniture Has the Most Painful Online Return Problem of Any Ecommerce Category

Furniture return rates sit at around 22.7% in 2026, and each return is catastrophically expensive. A returned dress costs $8–12 to ship back. A returned sofa costs $150–300 in freight, plus inspection, repackaging, and restocking. Some brands now run “keep it” policies on lower-value items because return shipping exceeds the product’s salvage value.
Factor | Apparel | Electronics | Furniture |
Avg return shipping cost | $8–12 | $15–25 | $80–300+ |
Can be resold as new? | Often | Usually | Rarely |
Return triggers | Fit, color | Specs | Size, color, style, room fit |
“It looked nothing like the photo” – real customer complaints
“Every version of this sofa looks the same on the website even though the actual fabric is completely different.” – Pottery Barn TikTok review, 343,000 views
“The table arrived black. They told me dark oak and dark elm are the same thing.” – MoneySavingExpert forum
This isn’t rare. A 2025 Fixtuur survey of 1,500 furniture buyers found 23% of UK shoppers returned large furniture items in the last two years, with 73% saying that’s “just how online shopping works.” Among Gen Z, that figure hits 31%.
What it actually costs brands in the USA and Europe
- USA: Processing returns costs 20–65% of the item value. U.S. retailers lose over $100 billion annually from return-related costs.
- Furniture Example (USA): With a $546 average order value (AOV) and a 40% return processing cost, each returned sofa creates around $218 in losses – before considering resale discounts or damaged inventory.
- Europe: Around 7% of European e-commerce revenue was returned in 2024.
- EU Challenge: European consumer protection laws make it harder for brands to refuse returns, making return prevention the most effective strategy.
- Furniture Example (Europe): A furniture brand generating €10M in annual revenue with a 10% return rate can lose approximately €500,000 per year in return logistics costs alone.
- 70% of furniture sellers report a direct reduction in returns after adopting 3D visualization technology (Fixtuur, 2025)
- Online return rates are 21% higher than in-store rates
Why furniture buyers regret more than any other category
Furniture is a high-involvement purchase. You’re choosing something that defines a room you’ll live in for years. Three things make it uniquely vulnerable to online regret:
- You can’t test it – no sitting on the sofa, no feeling the fabric
- Context matters more than the object – whether it looks “right” depends entirely on your existing room
- Returns are painful enough that buyers keep furniture they hate, then never buy from that retailer again
The Hidden Cost Most Brands Ignore
The financial loss per return is only the visible cost. The hidden costs include the customer who never returns to your store, the review they leave describing disappointment, and the competitor who wins their next furniture purchase because their product page answered the questions yours could not.
A 2025 DHL Ecommerce Trends Report found that 39% of customers return products because they do not match the images. That is not a returns management problem. That is a product representation problem – and it is entirely preventable.
The 5 Real Reasons Customers Return Furniture
According to DHL’s 2025 Ecommerce Trends Report, the #1 return reason is “wrong size.” But size is only one of five problems – and 3D models fix most of them directly.
Return Reason | Fixed by 3D? |
Wrong size / doesn’t fit the room | ✅ AR spatial placement |
Color looked different in person | ✅ Accurate material rendering |
Fabric texture / finish disappointment | ✅ Partial – 3D texture mapping helps |
Style mismatch with existing décor | ✅ Room context rendering |
Assembly confusion | ⚠️ Partial – 3D exploded views help |
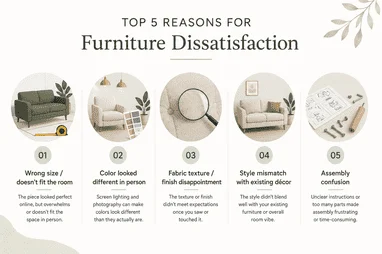
- Wrong size – the room does not fit. The #1 return trigger, confirmed by DHL’s 2025 report. Customers guess dimensions, miscalculate clearance, or simply cannot visualize scale from a flat image. AR spatial placement eliminates this by showing the product at exact scale in the customer’s actual room.
- Color looked different in person. Studio photography uses controlled lighting that distorts undertones. A “warm taupe” sofa arrives looking grey. 3D rendering with physically-based rendering (PBR) materials models how light interacts with fabric mathematically – consistently more accurate than any photoshoot.
- Fabric texture did not meet expectations. Photography cannot show whether velvet is short or long pile, whether leather is matte or semi-gloss, or whether a weave is tight or open. High-resolution 3D texture mapping provides far more tactile information than any studio image.
- Style mismatch with existing room décor. A product on a white background cannot tell a customer whether the piece will work alongside their existing furniture. Room context rendering – showing the model inside a styled, realistic room – directly answers this question.
- Assembly complexity surprise. Some returns happen because the product was more complex to assemble than expected, or physically larger when unboxed than imagined. 3D scale views and exploded models address this before purchase.
The color problem specifically: Studio photography uses lighting rigs that shift undertones. A “warm grey” sofa photographed under studio lights looks beige on screen, then arrives looking blue-grey in natural light. 3D rendering with physically-based materials (PBR) models how light interacts with a surface mathematically – far more accurate than any studio photo.
What Are 3D Furniture Models and How Are They Different from Regular Product Photos?
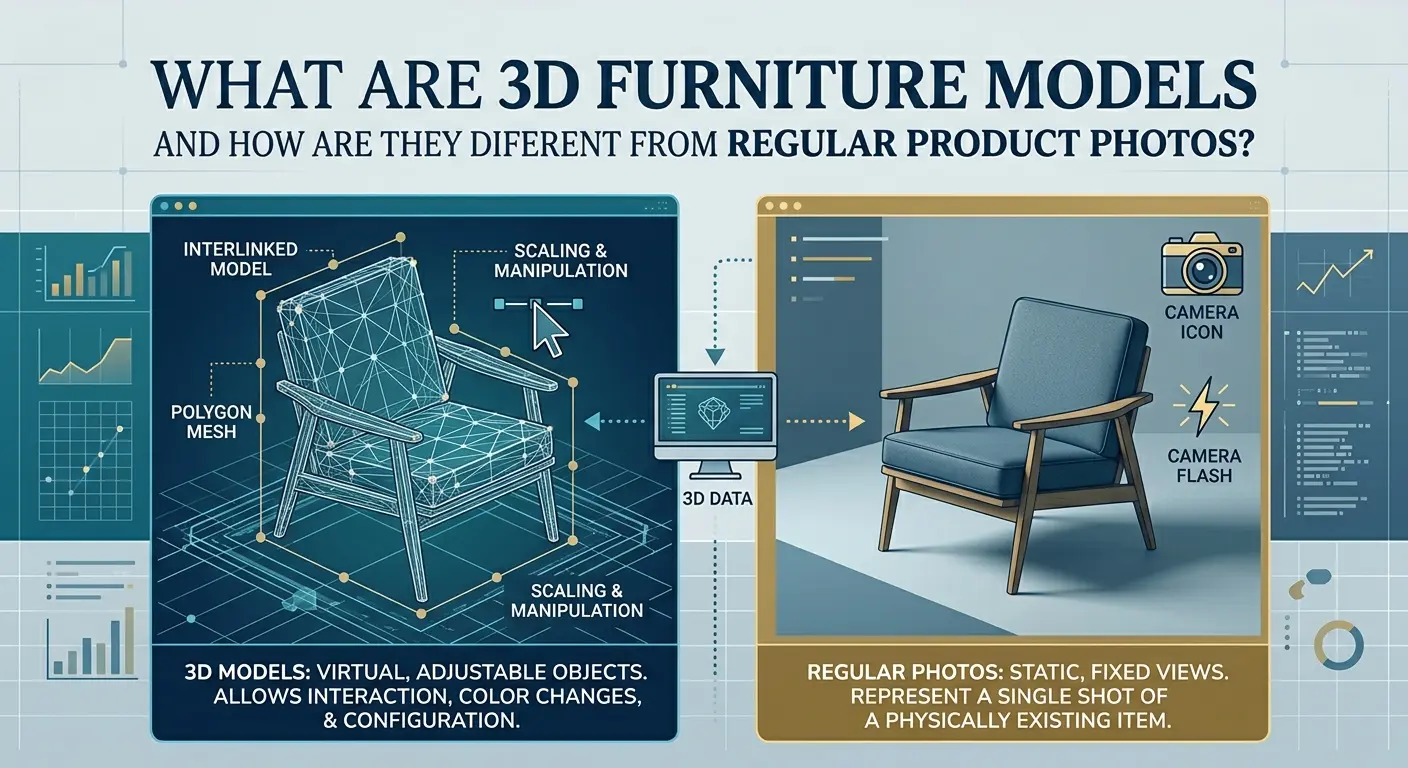
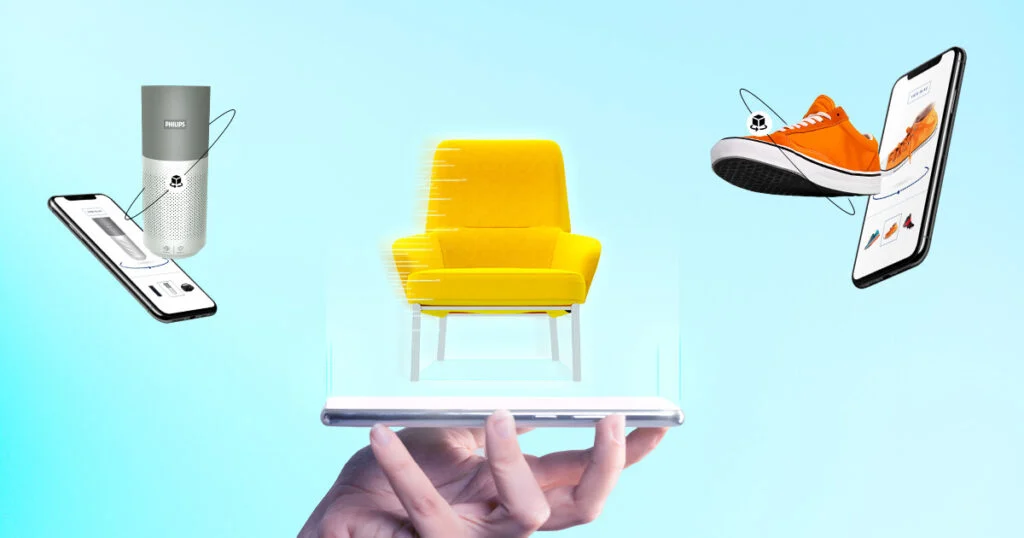
A product photo is a flat image at one moment in time. A 3D model is a mathematical representation that can be rendered from any angle, in any environment, with any configuration.
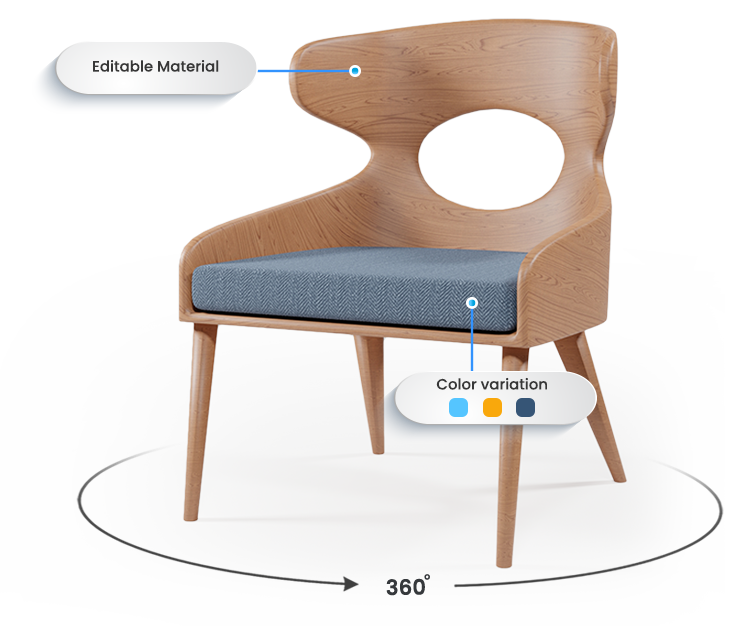
3D product visualization – the customer rotates the product 360°, zooms into upholstery detail, views from every angle. The baseline. Replaces photography almost immediately.
3D configurators – the customer builds the product in real time: picks the fabric, leg finish, configuration. One furniture brand saw 90% of orders shift to self-designed online purchases with zero sales team contact, plus a 25% increase in custom sales.
Augmented reality (AR) – the customer points their phone at their living room and the sofa appears at exact scale. They walk around it. They check clearance. AR implementation reduces furniture return rates by 40–70%. Size-related returns specifically drop by 71%.
👉 Read How Furniture 3D Modeling Works: 7 Proven Ways to Boost Sales & Revenue in 2026
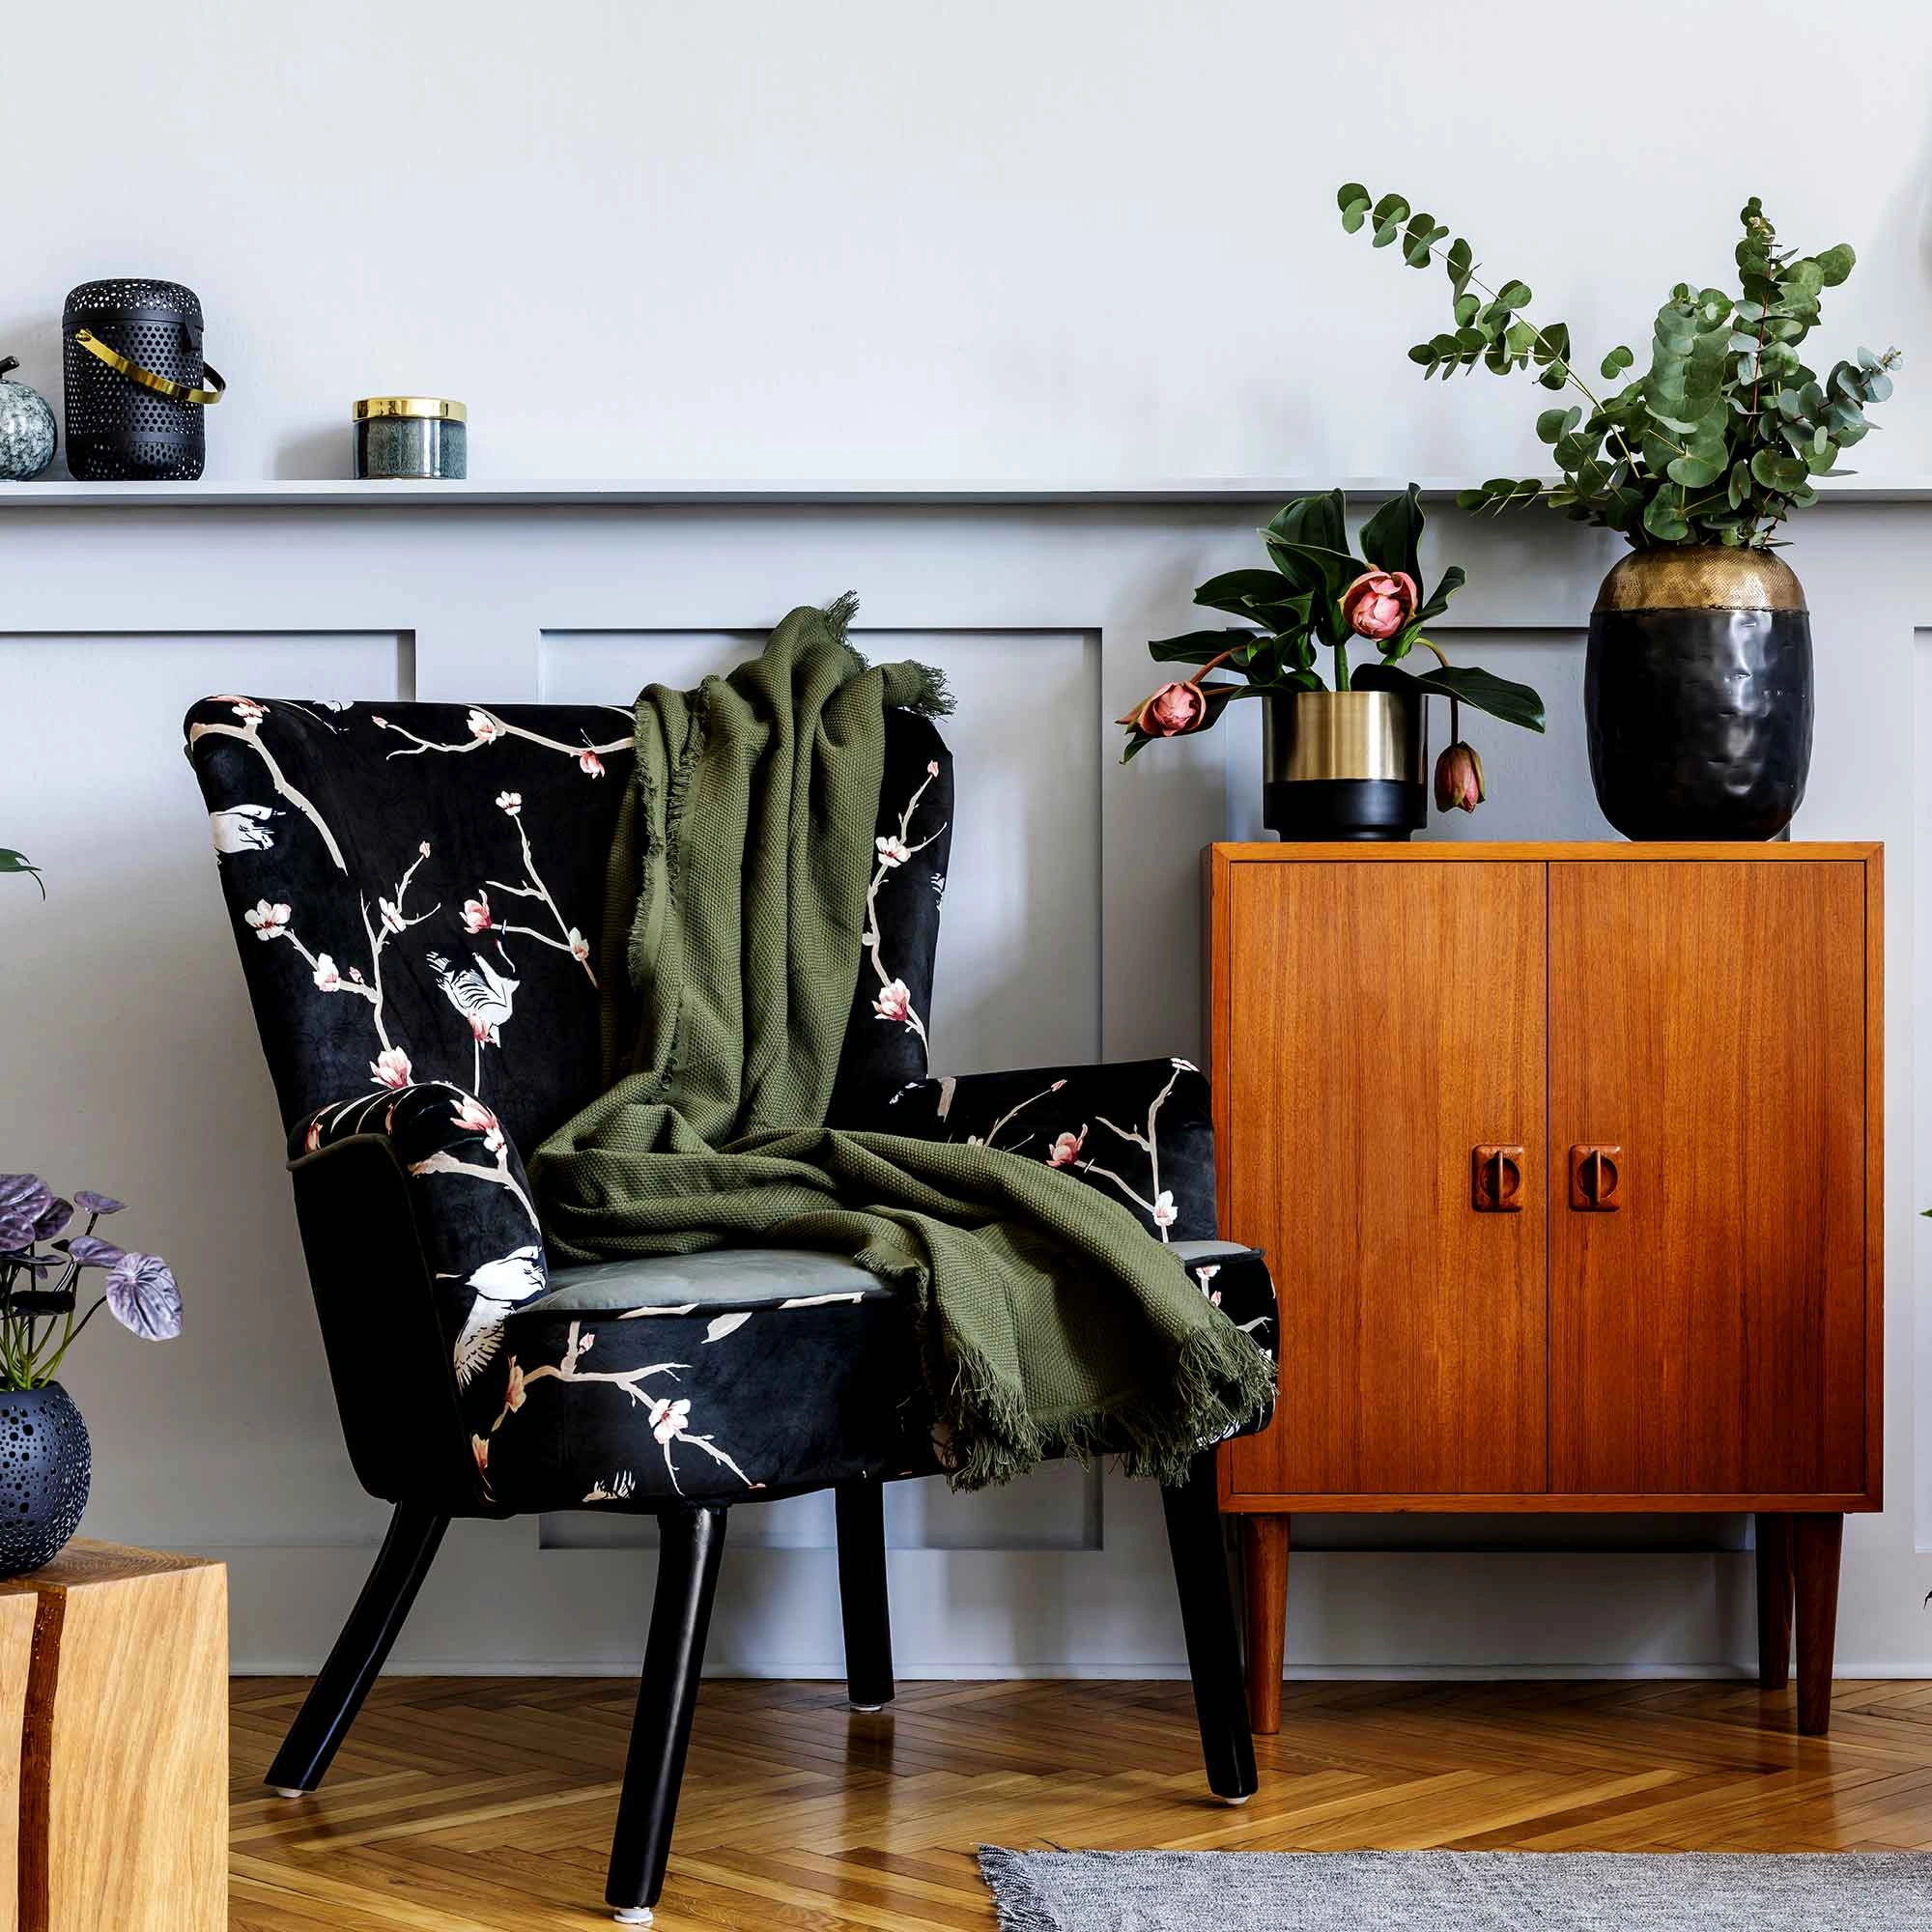
Room context rendering vs. plain product on white background
This is the gap nobody talks about enough. Even without AR, showing a sofa in a styled room versus floating on white drives meaningfully different conversion outcomes. Customers don’t buy furniture – they buy a room. A product on white tells them what the object looks like. A product in a room answers the question they’re actually asking: “Would this work in a space like mine?”
Room context rendering is cheaper than AR, requires no mobile interaction, and is the highest-leverage 3D upgrade for brands not yet ready for full AR.
The Data: How Much Do 3D Models Actually Reduce Furniture Returns?
Metric | Source |
AR reduces furniture return rates | 40–70% (1Center, 2025) |
Size-related return reduction | 71% |
Color/style mismatch return reduction | 58% |
Customers less likely to return after AR visualization | 64% (Magna Media Trials) |
Shoppers saying 3D/AR tools increase buying confidence | 47% (Fixtuur, 2025) |
Furniture sellers seeing return reduction after 3D adoption | 70% (Fixtuur, 2025) |
Purchase likelihood after using AR | 11x more likely (Wayfair) |
Revenue per visit uplift with 3D and AR | +106% |
By furniture category:
Category | Return reduction |
Sofas & seating | 73% |
Bedroom furniture | 81% room-fit accuracy |
Dining sets | 67% space-planning improvement |
What real brands saw
DFS implemented 3D and AR across 10,000+ products and achieved a 22-fold ROI – combining lower returns, higher conversion, and reduced content production costs.
Wayfair reports customers using AR features are 11x more likely to complete a purchase.
Cylindo clients saw +75% online revenue and +44% average order value.
Mid-size retailers using AR saved $500,000+ annually in return-related costs.
What Does a 1% Drop in Return Rate Actually Save Your Business?
Here’s a real worked example for a US furniture brand doing $5M in annual revenue:
Metric | Baseline | After 3D (40% return reduction) |
Return rate | 22.7% | 13.6% |
Cost per return (40% of $546 AOV) | $218 | $218 |
Annual return processing cost | ~$4.5M | ~$2.7M |
Annual saving | – | ~$1.8M |
That saving alone funds a full 3D implementation many times over.
EU context: A €10M revenue brand with a 10% return rate losing ~€500,000/year in logistics saves €200,000 annually with a 40% return reduction – comfortably covering the cost of a full 3D rollout.
What Furniture Shoppers Are Actually Saying Online
No competitor covers this. These are exact questions real buyers ask – and what each tells brands about the gap to close.
“I ordered a sofa online and it was the wrong color – what are my rights?” Your photography is creating an expectation your product can’t meet. PBR 3D rendering eliminates the studio-lighting distortion that causes most color disputes.
“How do I know if furniture will fit in my room before I buy it online?” The customer wants to buy but is paralyzed by uncertainty. AR spatial placement is a direct answer. If you don’t offer it, a competitor eventually will.
“Is it safe to buy a sofa online without seeing it in person?” This is a trust gap question. Every 3D model you publish is a trust signal – it says you’re confident enough in your product to show it from every angle.
“Why does online furniture look so different when it arrives?” Post-purchase regret turned into a question. Brands that break this pattern with accurate 3D visualization gain a long-term trust advantage that compounds into repeat purchases and word-of-mouth.
How to Add 3D Models to Your Furniture Product Pages
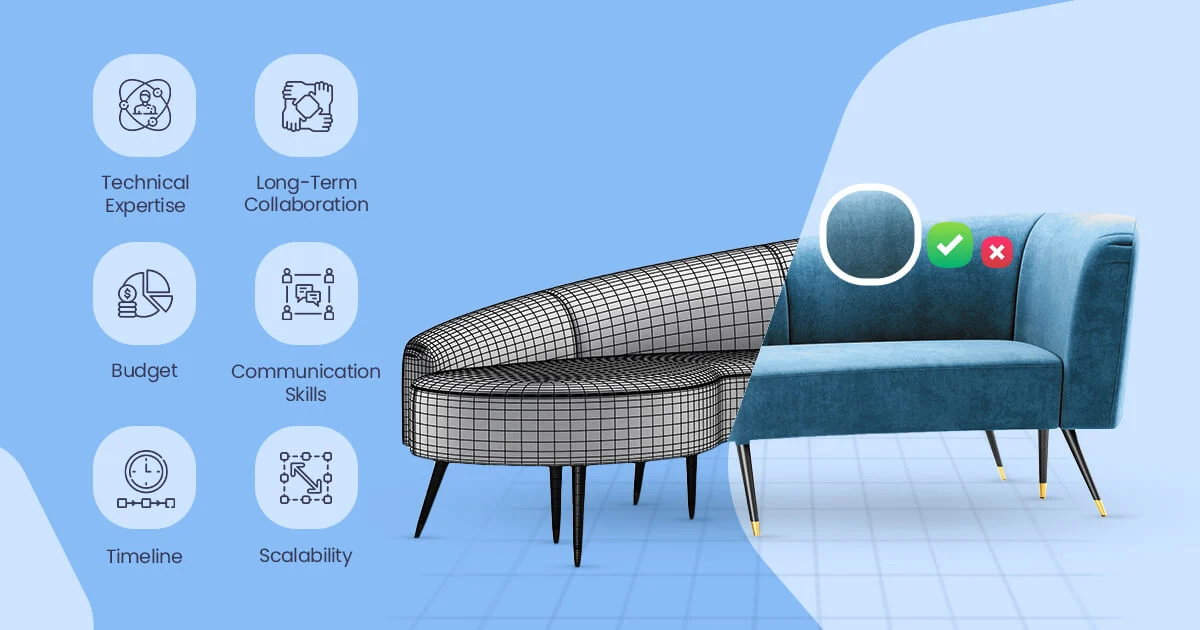
Step 1: Choose the right technology for your problem
- High return rate from size/fit → prioritize AR
- High return rate from color/fabric mismatch → prioritize 3D visualization with PBR materials
- High SKU complexity, many variants → prioritize 3D configurator
- Limited budget → start with 3D visualization on your top 20 highest-return SKUs
Don’t scope a full-catalog project on day one. Start with your 20 worst-performing products by return rate. Measure. Expand.
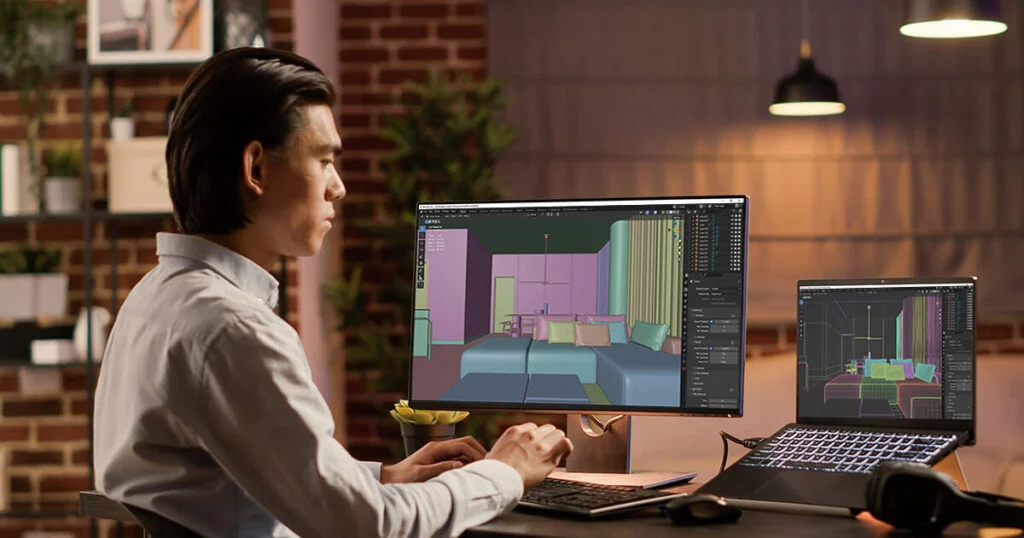
Step 2: Create your 3D models
Three options depending on budget and timeline:
Option | Cost per model | Timeline | Best for |
Commission 3D studio | $150–$800 | 1–3 weeks | Photorealistic quality, fabric accuracy |
AI-generated (Meshy.ai) | $5–$50 | Hours | Quick catalog population, simple geometry |
Convert from CAD files | Low (conversion only) | 1 week | Brands with manufacturer CAD access |
Technical note: AR requires low-polygon models (under 100,000 polygons). High-detail web viewer models are different files. Specify both in your brief. Always retain the original master file (FBX or OBJ) for future re-export.
Step 3: Integrate with your platform
Shopify has native 3D model support built in. Upload a .glb file – the 3D viewer appears automatically. iOS users get an AR “View in your space” button via Apple Quick Look. Zero development required.
WooCommerce uses plugins: AR for WooCommerce (browser-based AR, no app required), AtlasAR (supports configurators + automatic 70% file compression), or AR Model Viewer for WooCommerce (supports .glb/.gltf, includes AI model generation).
Magento / Adobe Commerce requires a custom approach – Threekit or Cylindo via enterprise API, or a custom Three.js/Babylon.js WebGL implementation. Budget 2–4 weeks of development beyond model creation.
Where to place the 3D viewer on your product page
Put the 3D viewer in your primary hero image slot – above the fold, impossible to miss. Products that bury it in a tab labeled “3D View” see dramatically lower engagement.
Optimal layout:
[3D Viewer – main image position]
[Thumbnail strip: angles + room context render]
[Title + price]
[Configuration options]
[Add to cart]
[“View in your room” AR button – directly below add to cart]
Mobile matters most: 51% of consumers now shop on mobile. Use WebAR (browser-based, no app download) so customers can activate AR directly from the product page. Lazy-load the 3D viewer so it doesn’t block page rendering. Keep model files under 15MB. A poorly implemented 3D viewer that hammers Core Web Vitals will hurt your SEO rankings and conversion rate simultaneously.
What 3D Models Cost in 2026 – and the Photoshoot Comparison
Costs have dropped significantly since 2022:
Model type | 2022 | 2026 |
Basic web viewer model | $300–$800 | $100–$300 |
High-detail AR model | $1,500–$5,000 | $400–$1,200 |
AI-generated basic model | N/A | $5–$50 |
- traditional photography for one sofa in 5 fabric variants:
- Photoshoot (day rate + studio + post): ~$2,400
- 3D model (base model + 5 material variants + AR file): ~$600–$1,150
- Photography cannot be reused when product changes. 3D models can be updated.
The photoshoot breaks even on the second update cycle. Platforms also report up to 70% savings in production costs when switching to 3D workflows.
Why European Furniture Brands Have an Extra Reason to Adopt 3D Models
Every competitor covers returns as a financial problem. For European brands, it’s also becoming a regulatory one.
Ecommerce product returns generate 5 billion pounds of waste and 15 million tons of CO2 annually. The EU Green Deal, Digital Product Passport requirements (rolling out 2026–2030), and Extended Producer Responsibility regulations are pushing brands to reduce product waste – and returns are a major contributor.
Brands that demonstrably lower return rates through better pre-purchase visualization are better positioned for:
- CSRD/ESRS sustainability reporting
- EU Ecodesign regulation compliance
- ESG investor metrics
- Consumer preference in markets where sustainability drives purchase decisions (Germany, Netherlands, Scandinavia)
Fewer returns = fewer freight movements = measurable CO2 reduction. That’s a reportable environmental metric, not just a cost saving.
Frequently Asked Questions
Do 3D furniture models actually reduce returns, or is it just marketing?
Yes. Data shows a 40–70% reduction in returns. It eliminates the “expectation gap” that causes most furniture returns.
How much does it cost to add 3D to my furniture product pages?
Modeling runs $100–$1,200 per item. A 20-product pilot typically costs $3k–$15k total.
Can I add 3D models to Shopify without custom development?
Yes. Upload a .glb file to any product. The viewer appears automatically. iOS users get AR via Apple Quick Look with no additional setup.
What is the difference between 3D visualization and augmented reality for furniture?
360° 3D lets customers rotate and zoom on their screens. AR uses their phone camera to “place” the item in their actual room at 1:1 scale. 3D builds interest; AR kills the “will it fit?” return trigger.
Are 3D product pages bad for SEO or page speed?
Not if done right. By using Draco compression and lazy loading, 3D files are often smaller than a gallery of high-res photos. One retailer saw a 15% faster load time after switching from heavy photography to optimized 3D.
Conclusion
The economics are clear. Furniture returns cost 20–65% of each item’s value to process. 3D models reduce that by 40–70%. The investment in models pays back within one quarter for most mid-size catalogs – and the conversion rate uplift is additional upside on top of the cost saving.
For US brands, this is a margin protection play. For European brands, it’s also a sustainability compliance advantage. Either way, the brands that implement this in 2026 build a structural advantage that compounds every year as customer expectations for 3D visualization continue to rise.
If you are ready to see exactly how 3D visualization would perform against your current return rate, get a project assessment from Orbe3D – 45+ professional artists, 8+ years of furniture-specific studio experience, and a track record of 1,100+ successful projects across the US and Europe.